- December digital edition 2022
- Volume 14
- Issue 12
Case report: Not all multiple sclerosis is equal
Multiple sclerosis is a neurodegenerative disease with ophthalmic manifestations. Although some cases come to attention following an attack of optic neuritis, embedded optic atrophy can be observed in other, longer-standing cases.
Online exclusive
Case 1
A Black man, aged 27 years, had received a diagnosis of and been treated elsewhere for multiple sclerosis (MS). Because of difficulty with distance vision and failing a driver license vision test, he attended for clinical ophthalmic evaluation. Aside from the diagnosis of MS, nothing in the medical history was contributory.
Central visual acuity was 20/40 in each eye at distance, not improving with pinhole or refraction, which was plano in each eye. The anterior segment of each eye was unremarkable. Intraocular pressure was measured by Goldmann applanation tonometry at 14/14 mm Hg at 9:15 AM. Clinical findings included color fundus photography, suprathreshold retina sensitivity evaluation, and optical coherence tomography (OCT). These results are presented in Figures 1, 2, and 3, respectively.
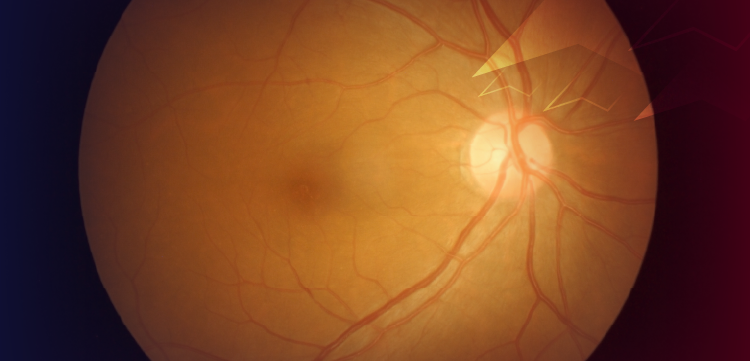
Of note, the ocular fundus images show clear media, distinct disc margins with disc pallor but without cupping, diminished presence of arcuate retinal nerve fiber layer (RNFL) bundles, and consequent enhanced choroidal visibility relatively symmetrical in each eye. The visual field result demonstrated central depressions symmetrically in each eye. This protocol was chosen as a screening or triage strategy before deciding on more specific visual field testing.
Thickness, deviation map, and B-scan presentation all show attenuated RNFL thickness. The retinal thickness map shows symmetrically thinned inner retina in each eye. Looking specifically at the deviation section of the scans, the instrument judges that the inner retinal thickness (ganglion cell complex) is not attenuated, and fewer than 1% of patients in the reference database exhibited such a thin presentation. This is reflected in the absolute values, which hover near 50 microns. Anatomically, this thickness would be consistent with the presence of little remaining neural tissue, but rather supportive and connective tissue, such as Müller cells. (See figures for additional details.)
MS is a neurodegenerative disease with ophthalmic manifestations. Some cases come to attention following an attack of optic neuritis. In longer-standing cases, embedded optic atrophy is observed, as in the present case. Although this case is symmetrical, asymmetry between the eyes may be present, as we see in the next case.
Case 2
A Black woman, aged 30 years, attended for clinical evaluation after relocating from another area. As in the previous example, aside from the MS diagnosis, the medical history was noncontributory. Central visual acuity was 20/20 in the right eye and 20/100 at distance, not improving with pinhole or refraction (OD: –4.00 –1.25×175, OS: –3.25 –1.50×005). The anterior segments were unremarkable. Intraocular pressure was measured by Goldmann applanation tonometry at 16/17 mm Hg at 9:00 AM.
Following pupillary dilation, color fundus photography, visual field testing, and optical coherence tomography (OCT) were ordered. Figures 4-6 show these results. Of note and consistent with other clinical findings, the central 10° visual field of the left eye shows significant depressions.
The OCT result in Figure 5 shows relatively symmetrical inner retinal layer thinning, which is similar to the first case. This appears to be congruous with the visual field but incongruous with visual acuity data. Reconciliation of these findings may be answered by sophisticated imaging modalities.
Discussion
In both presently reported cases, the diagnosis of MS had been established, and ophthalmic evaluation demonstrated clinical findings consistent with the diagnosis. In these cases, OCT provides a quantitation of retinal thickness that gives an indirect measure of axonal and neuronal loss of the anterior visual pathways. OCT was initially developed for imaging of the retina and has proved useful in managing disorders such as age-related macular degeneration and diabetic retinopathy, among others.
Although RNFL thickness is significant in retinal diseases, its application to optic neuropathies has been highlighted in glaucoma diagnosis and trajectory of management. Additionally, attention to the OCT findings in other descending optic neuropathies has grown in the past decade.1-10 OCT has been shown to be accurate and precise in measuring absolute thicknesses within the retina including the overall RNFL, as well as the inner retinal complex.1 The inner retinal complex, sometimes labeled as the ganglion cell complex, may serve as a marker in early glaucoma and MS as well as other descending optic neuropathies.4-8
Early reports of the relationship of MS to RNFL thinning demonstrated a difference between healthy controls, as well as between a nonaffected eye and the affected eye in the same individual.11,12 Quantitating peripapillary RNFL loss following acute optic neuritis episodes varies between 10 and 40 µm, which is stable between 1 and 12 months.7,8 Given that there is significant attenuation of the RNFL in 3 of the 4 eyes reported here, it can be deduced that each of these eyes had suffered an episode of optic neuritis. Although RNFL thinning is not specific to MS, it has been noted that the pattern of RNFL thinning in conjunction with clinical findings can confirm the diagnosis of this descending optic neuropathy.7
OCT was a significant milestone in retinal evaluation and has continued to evolve. OCT-angiography (OCT-A) has contributed to our understanding of ocular diseases, which includes, as mentioned above, glaucoma, age-related macular degeneration, diabetic retinopathy, and now MS. Reports have appeared that demonstrate the congruity of RNFL thickness attenuation with reduced capillary density. Additionally, OCT-A may play a complementary role in the diagnosis and follow-up of patients with MS, as is being employed in glaucoma.2,6 Some have explored the correlation between functional compromise and RNFL attenuation.11,12
A recent review had proposed the positive relationship between RNFL attenuation and cognitive and physical disability as measured by MRI.7,12 In fact, OCT-measured RNFL attenuation has been suggested as a biomarker for MS.5,7 Another aspect of RNFL thinning is that it may be a sentinel for other descending optic neuropathies from Alzheimer and Parkinson diseases to traumatic brain injury.1,9 With external clinical findings, it may be possible to follow the trajectory of patients suffering from the complications of these diverse disorders.
As useful as OCT and OCT-A may be for quantitating the RNFL, differentiation of the case of pale optic discs from the myriad potential causes may be obscure. This was demonstrated in studies looking at a series of optic neuropathies that found both capillary and RNFL attenuation were present, but no OCT-A pattern emerged as being anatomically consistently useful for distinguishing among the optic neuropathies.7,10 Although distinction among optic neuropathies may not be possible with either OCT or OCT-A, these modalities may be valuable in identifying neurodegeneration secondary to traumatic brain injury. A recent longitudinal study reported that progressive neural degeneration was seen among this cohort vs a control group. These authors correlated more rapid attenuation of RNFL with more severe trauma score.9
RNFL attenuation has been a consistent finding in MS, a descending optic neuropathy. Recent evidence has associated RNFL thinning and specifically inner retinal thinning with other descending optic neuropathies. Going forward, OCT and OCT-A will give us the opportunities to quantitate RNFL thickness and peripapillary, as well as macular capillary indices, and correlate these values with other clinical findings.
References
1. Lamirel C, Newman NJ, Biousse V. Optical coherence tomography (OCT) in optic neuritis and multiple sclerosis. Rev Neurol (Paris). 2010;166(12):978-986. doi:10.1016/j.neurol.2010.03.024
2. Wang X, Jia Y, Spain R, et al. Optical coherence tomography angiography of optic nerve head and parafovea in multiple sclerosis. Br J Ophthalmol. 2014;98(10):1368-1373. doi:10.1136/bjophthalmol-2013-304547
3. Petzold A, Balcer LJ, Calabresi PA, et al; ERN-EYE IMSVISUAL. Retinal layer segmentation in multiple sclerosis: a systematic review and meta-analysis. Lancet Neurol. 2017;16(10):797-812. doi:10.1016/S1474-4422(17)30278-8
4. Britze J, Frederiksen JL. Optical coherence tomography in multiple sclerosis. Eye (Lond). 2018;32(5):884-888. doi:10.1038/s41433-017-0010-2
5. Alonso R, Gonzalez-Moron D, Garcea O. Optical coherence tomography as a biomarker of neurodegeneration in multiple sclerosis: a review. Mult Scler Relat Disord. 2018;22:77-82. doi:10.1016/j.msard.2018.03.007
6. Spain RI, Liu L, Zhang X, et al. Optical coherence tomography angiography enhances the detection of optic nerve damage in multiple sclerosis. Br J Ophthalmol. 2018;102(4):520-524. doi:10.1136/bjophthalmol-2017-310477
7. Iorga RE, Moraru A, Ozturk MR, Costin D. The role of optical coherence tomography in optic neuropathies. Rom J Ophthalmol. 2018;62(1):3-14.
8. Murphy OC, Kalaitzidis G, Vasileiou E, et al. Optical coherence tomography and optical coherence tomography angiography findings after optic neuritis in multiple sclerosis. Front Neurol. 2020;11:618879. doi:10.3389/fneur.2020.618879
9. Gilmore CS, Lim KO, Garvin MK, et al. Association of optical coherence tomography with longitudinal neurodegeneration in veterans with chronic mild traumatic brain injury. JAMA Netw Open. 2020;3(12):e2030824. doi:10.1001/jamanetworkopen.2020.30824
10. Abri Aghdam K, Aghajani A, Razi-Khosroshahi M, Soltan Sanjari M, Chaibakhsh S, Falavarjani KG. Optical coherence tomography angiography and structural analyses of the pale optic discs: is it possible to differentiate the cause? Curr Eye Res. 2021;46(12):1876-1885. doi:10.1080/02713683.2021.1929331
11. Parisi V, Manni G, Spadaro M, et al. Correlation between morphological and functional retinal impairment in multiple sclerosis patients. Invest Ophthalmol Vis Sci. 1999;40(11):2520-2527.
12. Trip SA, Schlottmann PG, Jones SJ, et al. Retinal nerve fiber layer axonal loss and visual dysfunction in optic neuritis. Ann Neurol. 2005;58(3):383-391. doi:10.1002/ana.20575
Articles in this issue
about 3 years ago
Helping patients with poor adherenceabout 3 years ago
Identifying contoured prism lens patientsabout 3 years ago
Geographic atrophy: What to know and whyabout 3 years ago
Presbyopia: The ever-changing environment and elusive Holy Grailabout 3 years ago
Making sense out of presbyopia clinical study dataabout 3 years ago
Getting started: methods of initial scleral lens selectionNewsletter
Want more insights like this? Subscribe to Optometry Times and get clinical pearls and practice tips delivered straight to your inbox.


