

Publication|Articles|September 10, 2024
- September digital edition 2024
- Volume 16
- Issue 09
Contemporary care in GA: Practice patterns are evolving
Author(s)James L. Fanelli, OD, FAAO
By identifying progressive GA earlier, primary eye care providers can make timely referrals and save patients’ visual function.
Advertisement
With newly available treatment options for slowing the progression of geographic atrophy (GA), an advanced form of age-related macular degeneration (AMD), optometrists have an essential role to play in ensuring appropriate patients receive timely care. Although optimal patient selection and therapeutic best practices continue to evolve, what is certain is that early identification is the key to preserving visual function. With timely treatment, we can help patients see for as long as possible.
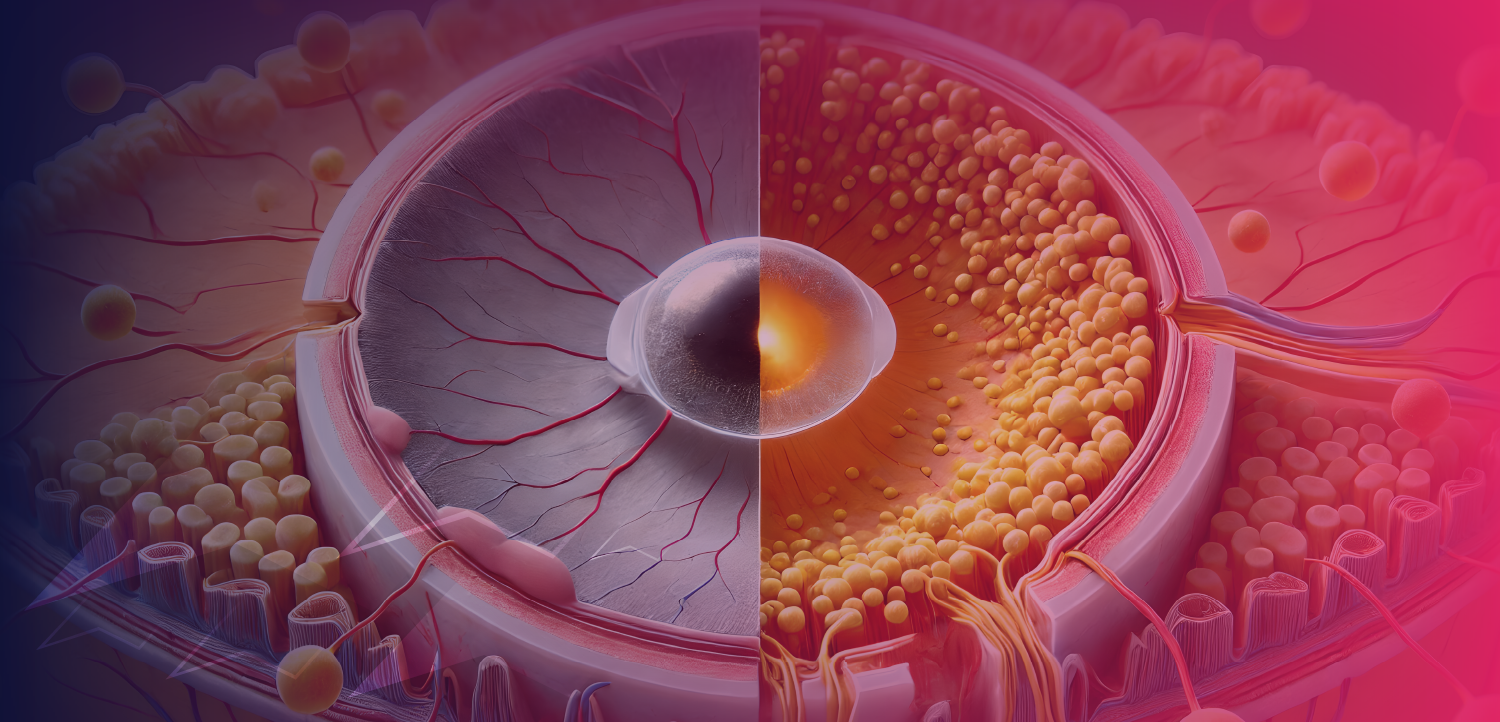
Late-stage AMD most significantly affects vision
Once GA progresses to a more advanced stage, it is characterized by localized sharply demarcated atrophy of outer retinal tissue, retinal pigment epithelium (RPE), and choriocapillaris. It commonly begins with the involvement of the perifoveal region and expands over time to involve the fovea, ultimately leading to central scotomas and permanent visual acuity loss. Affecting more than 8 million people worldwide, GA accounts for approximately 20% of all individuals with AMD.1
The rate of GA progression varies widely but is typically relatively slow and occurs over a matter of years. As the atrophic area expands, visual function decreases. The fovea can be spared for a long time, with visual acuity remaining nearly normal, but contrast sensitivity and reading vision suffer. However, when the fovea is involved, loss of visual function can be rapid.2
Last year, the FDA approved the complement C3 inhibitor pegcetacoplan injection (Syfovre; Apellis Pharmaceuticals, Inc) as the first therapy indicated to slow the progression of GA secondary to AMD. The agent’s approval was based on the phase 3 OAKS and DERBY studies, which showed that monthly or bimonthly intravitreal injections reduced the growth rate of GA lesions in 2 years compared with sham.3,4 The complement C5 inhibitor avacincaptad pegol intravitreal solution (Izervay; Astellas Pharma Inc) was approved a few months later.
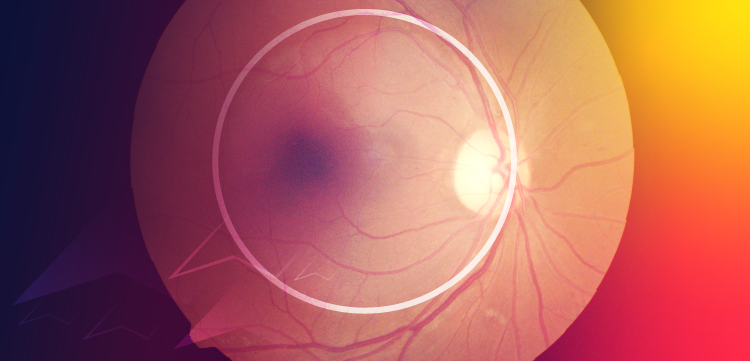
Fundus autofluorescence
Noninvasive fundus autofluorescence (FAF) is the standard imaging technology currently used to visualize the RPE in patients with GA, both for the clinic and in research. Instead of fluorescein dye to image the retina (as in fluorescein angiography), FAF leverages the autofluorescent properties of lipofuscin. A byproduct of lysosomal breakdown of photoreceptor outer segments, lipofuscin comprises numerous bisretinoids that absorb blue light and emit yellow-green light. The resulting image is essentially a density map of lipofuscin, where brighter areas represent regions of increased lipofuscin density. Because many retinal pathologies often lead to RPE dysfunction and an accumulation of lipofuscin, abnormal patterns of autofluorescence on FAF imaging can act as markers for retinal disease.
Abnormal regions of hyperautofluorescence due to increased lipofuscin levels usually occur secondary to RPE dysfunction (diseased/dying cells), and abnormal regions of hypoautofluorescence indicate decreased lipofuscin levels due to decreased RPE density (eg, RPE atrophy or RPE rupture). FAF provides important information on the expected GA progression rate through the amount of hyperautofluorescence noted in the junctional zone of the lesion.5,6 Healthy RPE cells have a fine, granular salt-and-pepper autofluorescence appearance owing to a uniform distribution of lipofuscin throughout the RPE cells, which are still very viable. As the metabolic activity of the cells tends to malfunction, less of the lipofuscin is processed as waste and its concentration builds up in the RPE cells.
In turn, this increases the level of autofluorescence in the RPE, and they appear brighter in FAF imaging. When we see this hyperfluorescence, we are looking at areas of the RPE that are metabolically stressed and at a higher risk of eventually atrophying. Ultimately, once the RPE cells atrophy, they become hypofluorescent, indicating RPE death (Figures 1-4).Thus, FAF provides valuable diagnostic information on areas of GA that are likely to progress, thereby allowing us to identify patients who are good candidates for therapy.
In particular, individuals with disease that is progressing outside the fovea will likely not have significant visual effects until further down the road and should be monitored. If FAF shows hyperfluorescent areas marching toward the fovea, that patient may be best served with earlier treatment before they lose significant central acuity. In other words, with FAF, we can identify patients who can be referred to a retina specialist for treatment before the central fovea is involved. This is an exciting development that requires optometrists to adopt a new mindset.
In 1995, Delori et al became the first to use autofluorescence for in vivo fundus imaging to characterize the intrinsic autofluorescent properties of the human retina.7 As technology has advanced, major device manufacturers have introduced a variety of commercially available FAF imaging platforms. Each device has its own pros and cons, depending on the type of imaging, (eg, confocal scanning laser ophthalmoscope, ultra-widefield scanning laser ophthalmoscope, broad line fundus imaging, fundus camera), the excitation wavelength (eg, green short wavelength, blue short wavelength, near-infrared), and the field of view desired.
I favor Heidelberg Engineering’s SPECTRALIS imaging system with BluePeak autofluorescence, which uses confocal laser scanning and a pure blue laser to provide clear, high-contrast images of metabolic activity. When combined with retinal layer segmentation obtained with optical coherence tomography (OCT), FAF allows us to assess morphologic alterations associated with functional change. It also includes the RegionFinder software, which is helpful to easily align BluePeak images from different visits and to generate progression movies, helping to visualize the changes. I believe this is the optimal way to follow patients with GA. OCT tells us what’s structurally happening in the retina now. On the other hand, FAF tells us which areas of the retina and RPE are already nonfunctioning and, more importantly, which areas are most likely to malfunction and affect vision. At the same time, it may also give us a window to the future by showing what cells will atrophy and therefore likely indicate future vision loss due to GA progression.
Conclusion
With an ever-growing array of treatment options for both wet and dry AMD, retina specialists are exceedingly busy. By choosing to monitor at-risk patients, optometrists can streamline patient care and help keep ophthalmologists from becoming bogged down by patients with GA who do not yet require therapy. More importantly, however, it is an opportunity to help preserve patients’ vision. As primary eye care providers, we are the first line of defense against all age-related retinal diseases. Multimodal OCT imaging with FAF is a powerful diagnostic weapon.
References:
Fleckenstein M, Mitchell P, Freund KB, et al. The progression of geographic atrophy secondary to age-related macular degeneration. Ophthalmology. 2018;125(3):369-390. doi:10.1016/j.ophtha.2017.08.038
Holz FG, Pauleikhoff D, Klein R, Bird AC. Pathogenesis of lesions in late age-related macular disease. Am J Ophthalmol. 2004;137(3):504-510. doi:10.1016/j.ajo.2003.11.026
Goldberg R, Heier JS, Wykoff CC, et al. Efficacy of intravitreal pegcetacoplan in patients with geographic atrophy (GA): 12-month results from the phase 3 OAKS and DERBY studies. Invest Ophthalmol Vis Sci. 2022;63(7):1500.
Biarnés M, Garrell-Salat X, Gómez-Benlloch A, et al. Methodological appraisal of phase 3 clinical trials in geographic atrophy. Biomedicines. 2023;11(6):1548. doi:10.3390/biomedicines11061548
Holz FG, Bindewald-Wittich A, Fleckenstein M, et al. Progression of geographic atrophy and impact of fundus autofluorescence patterns in age-related macular degeneration. Am J Ophthalmol. 2007;143(3):463-472. doi:10.1016/j.ajo.2006.11.041
Bearelly S, Khanifar AA, Lederer DE, et al. Use of fundus autofluorescense images to predict geographic atrophy progression. Retina. 2011;31(1):81-86. doi:10.1097/IAE.0b013e3181e0958b
Delori FC, Dorey CK, Staurenghi G, Arend O, Goger DG, Weiter JJ. In vivo fluorescence of the ocular fundus exhibits retinal pigment epithelium lipofuscin characteristics. Invest Ophthalmol Vis Sci. 1995;36(3):718-729.
Articles in this issue
over 1 year ago
Inside the overlap between scleral lenses and dry eyeover 1 year ago
Case report: Superior limbic keratoconjunctivitisover 1 year ago
To treat or not to treat: Fixing the glitch in glaucomaNewsletter
Want more insights like this? Subscribe to Optometry Times and get clinical pearls and practice tips delivered straight to your inbox.
Advertisement
Related Content
Advertisement


Latest CME


Advertisement
Advertisement