Time in range as an alternative to HbA1c
New evidence provides ODs with increasingly accurately gauge of patients’ diabetes control and risk of vision loss.
Time in range is expressed as a percentage of time a diabetic patient’s blood sugar is within target values. It makes it possible to see how much time a patient spends with low blood sugar, which can go otherwise unnoticed.
For decades, glycosylated hemoglobin (HbA1c) has been the “gold” standard laboratory metric for the quality of blood glucose control in patients with diabetes. It is also among the best markers for development and worsening of microvascular complications, including diabetic retinopathy.
More recently, with the advent and wide-scale adoption of continuous glucose monitoring (CGM) devices, multiple shortcomings of HbA1c measurement have become apparent to both patients and providers alike. These shortcomings include poor/inadequate correlation with average blood glucose levels and underestimation of the degree and impact of high and low blood glucose levels on patients’ quality of life and risk of bad outcomes.
Here, I will review key differences between HbA1c and glucose time-in-range (TIR) derived from frequent self-measurement of blood glucose (SMBG) and CGM systems. My hope is to better prepare ODs to more accurately gauge patients’ diabetes control and risk of vision loss based on the latest evidence.
Related: Case review of challenging ocular surface disease
Glucose ranges
Glycosylated hemoglobin is not a faithful measurement of “average” blood sugar control. Work by Beck et al has shown that for any given HbA1c value, a wide range of mean blood sugar levels correspond to that value.1
For example, for an HbA1c of 7 percent evaluated in a sample of 387 subjects, the mean glucose ranged from 135 mg/dl to 185 mg/dl among patients assessed via calibrated, continuous glucose monitoring (CGM) systems with measurements taken every 5 minutes for a mean of 66 days. This wide range demonstrates a significant discord between A1c and the clinically measured average among diabetes patients.
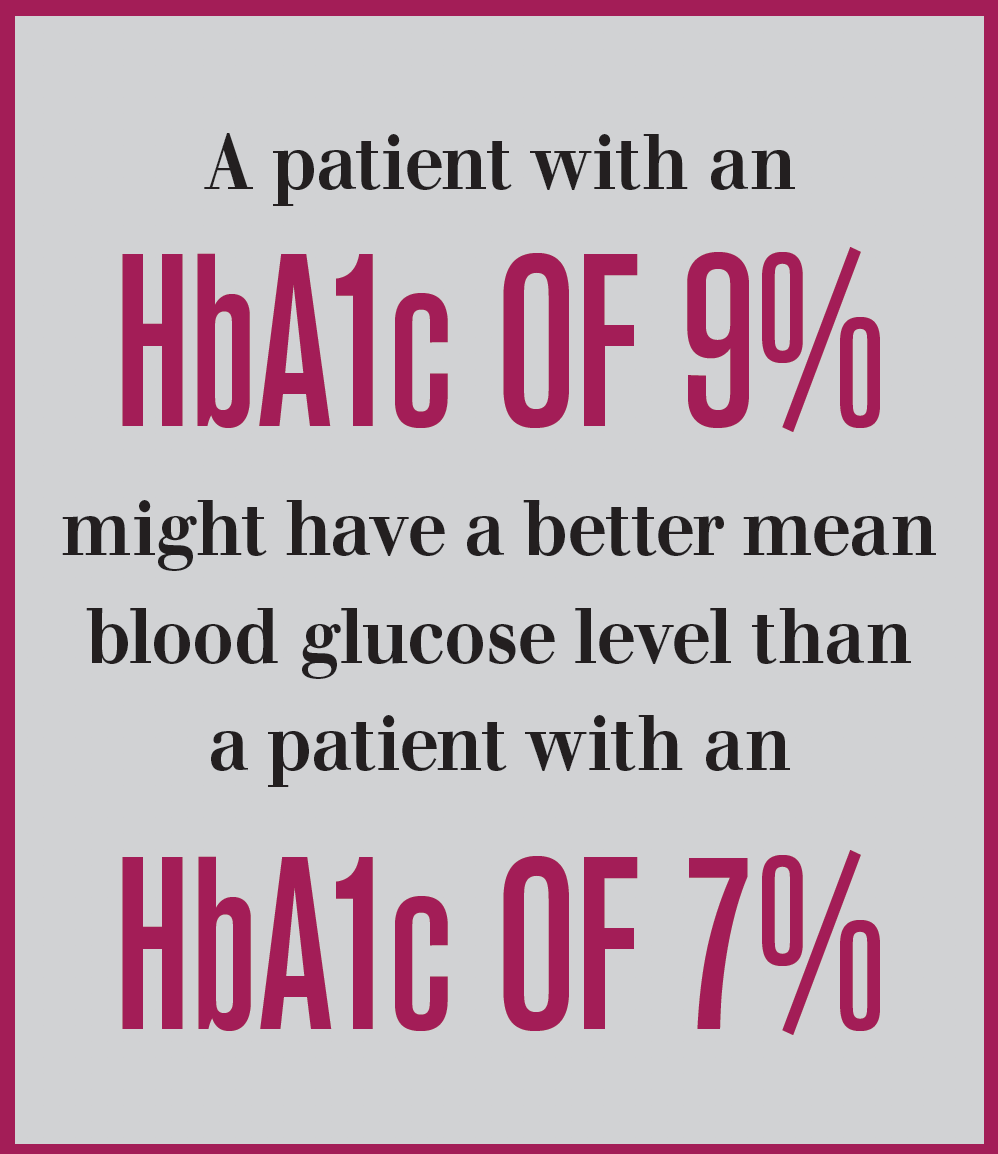
To put a finer point on it, Beck’s dataset shows that a patient with an HbA1c of 9 percent might, in reality, have a better mean blood glucose level than a patient with an HbA1c of 7 percent. Similar findings were shown in a larger dataset of 545 adult, type 1 diabetes patients.2
Related: New guidelines out for diabetes patient care
Continuous monitoring
CGM systems employ a subcutaneous filament sensor inserted in the abdomen or arm to continuously measure interstitial glucose levels and corresponding blood glucose levels on a 24/7 basis over 7 to 10 days. Measurements are automatically relayed via a transmitter to a receiver that patients view, which also includes graphic display of glucose values over time (8 to 24 hours), rate of glucose change, and audible/vibration warnings when glucose is high or low or when the rate of change is excessive.
A variation on CGM is “flash” glucose monitoring, which requires patients to manually scan a sensor placed on the upper arm as frequently as desired to reveal instantaneous (flash) glucose measurements over a 14-day period.
Related: New-onset, atypical retinopathy in a patient with diabetes
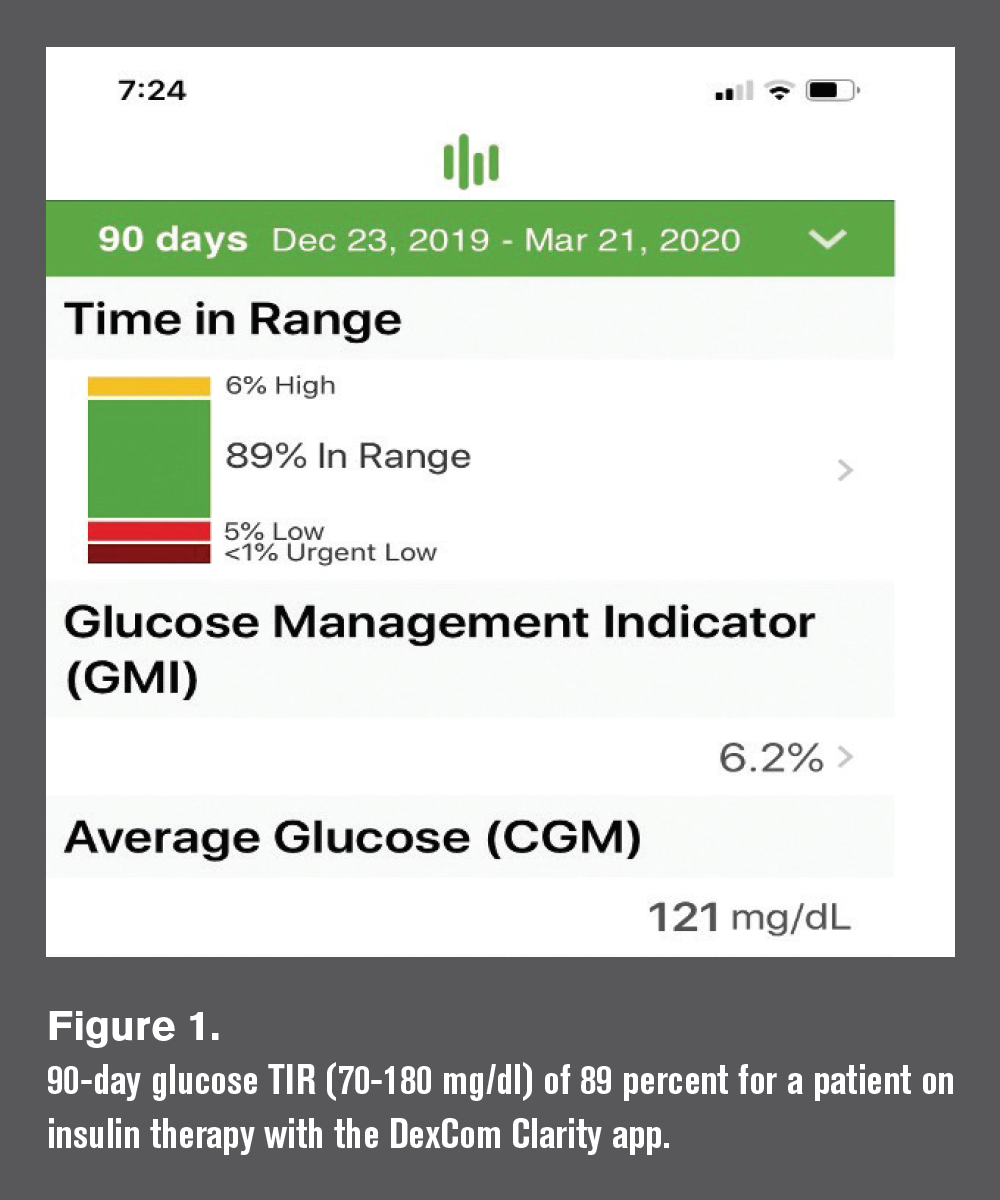
Both types of glucose sensors facilitate easy measurement of glucose time-in-range (TIR), which refers to the percentage of time a patient’s blood glucose levels are within a pre-specified range, typically 70 to 180 mg/dl, over a specified time interval, ranging from 2 to 90 days (see Figure 1).
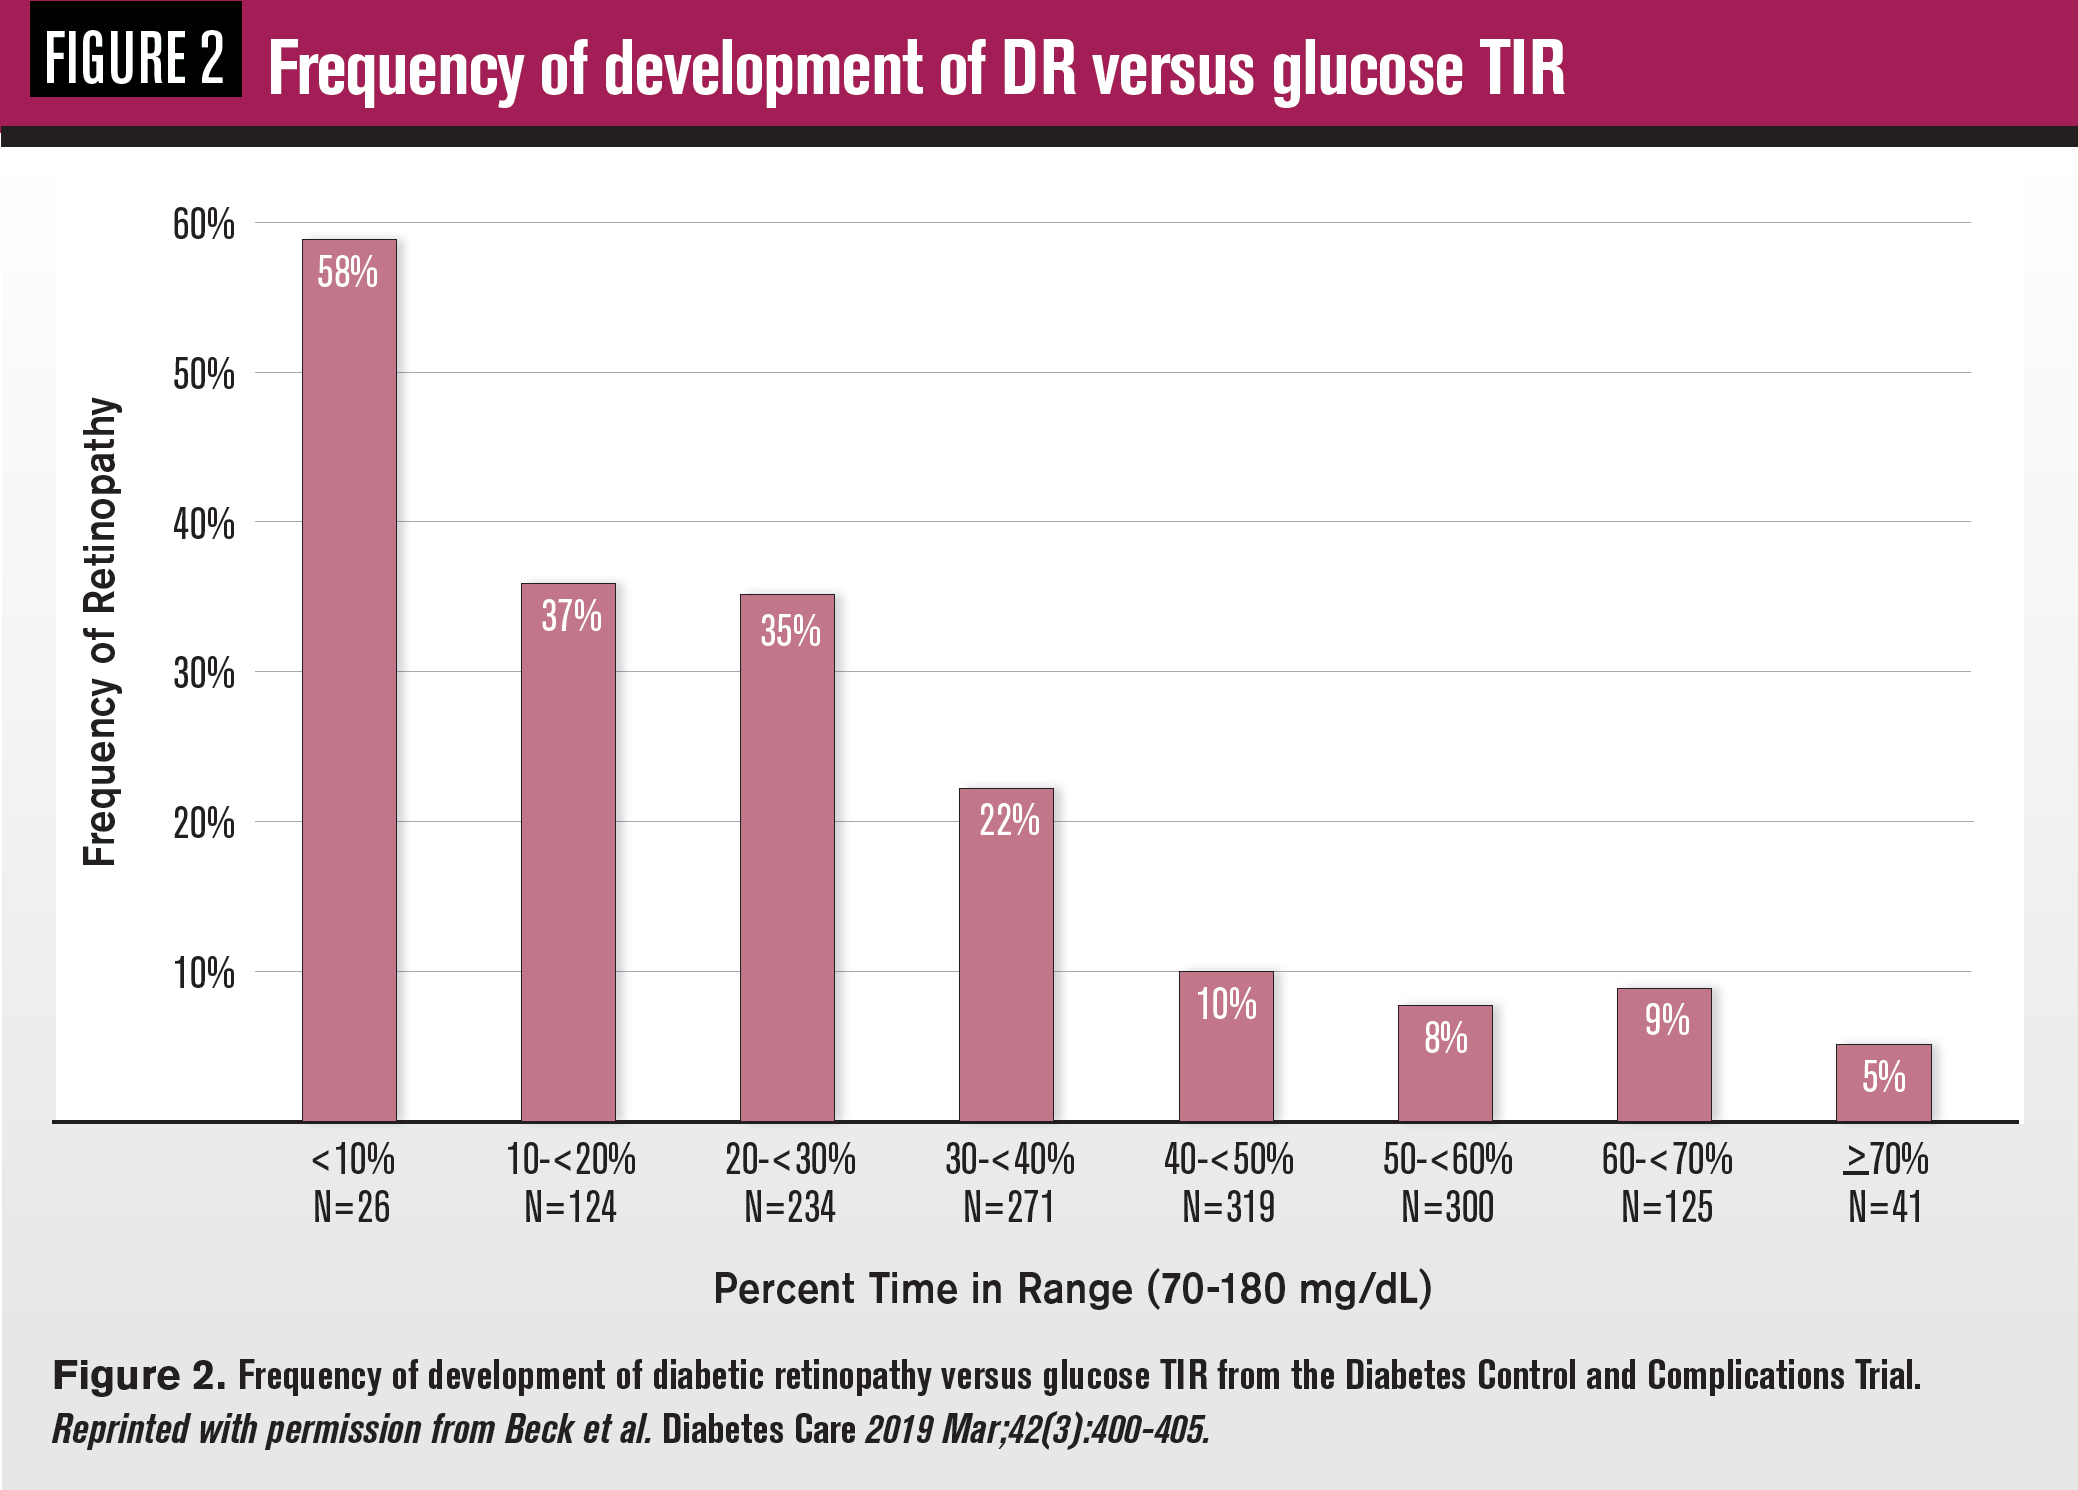
Analysis of 7-point, daily spot glucose data gathered from 1,440 subjects in the landmark Diabetes Control and Complications Trial (DCCT) showed that a 10 percent increase in TIR reduced the risk of diabetic retinopathy development by 61 percent and early kidney disease by 40 percent independently of HbA1c3 (see Figure 2).
Analysis of CGM data from 3,262 type 2 diabetes subjects revealed similar risk reduction for all stages of diabetic retinopathy after all adjustments, including HbA1c,4 underscoring the value of TIR as an additional metric to consider in study outcomes and clinical assessment of individual patient risk for the onset and progression of diabetic retinopathy.
Related: OCT in DR follow-up highlights importance of retina-vitreous attachment
Moreover, TIR is an immediately visible, understandable, and malleable value in patients’ day-to-day efforts at achieving good glucose control. The International Consensus Panel on Time In Range recently released recommendations that most patients with type 1 and type 2 diabetes strive for a TIR >70 percent.5
Importantly, CGM algorithms also calculate the percentage of time patient glucoses are “above range” (> 80 mg/dl), “below range” (<70 mg/dl) and “very low” (<55 mg/dl). These metrics facilitate corrective measures by patients and physicians alike, giving insight into daily, temporal fluctuations in blood glucose levels that cannot be assessed by HbA1c.
Moreover, variations in patient hemoglobin status (anemia, polycythemia, chronic kidney disease, and genetic hemoglobinopathies) may render HbA1c totally unreliable in some patients.6
This is not to say that HbA1c is not still relevant for most patients. Research has shown that HbA1c is highly predictive of diabetic eye disease in both type 1 and type 2 diabetes.7
What can be said is HbA1c is reasonably correlated with average blood glucose levels in most patients and A1c levels are directly linked to risk of microvascular complications in most patients. CGM measurements give additional insight into patients’ metabolic control and may explain why patients with the same A1c values experience significantly different outcomes in the development and progression of diabetic retinopathy, even after controlling for other established risk factors like diabetes duration and blood pressure control.8
When possible, ODs and MDs should ask patients with diabetes about glucose time-in-range, counsel them about its significance to diabetic retinopathy, and encourage TIR goals consistent with ocular risk reduction.
More by Dr. Chous: Research initiatives offer treatment options for diabetes patients
References:
1. Beck RW, Connor CG, Mullen DM, Wesley DM, Bergenstal RM. The Fallacy of Average: How Using HbA1c Alone to Assess Glycemic Control Can Be Misleading. Diabetes Care. 2017 Aug;40(8):994-999.
2. Beck RW, Bergenstal RM, Cheng P, Kollman C, Carlson AL, Johnson ML, Rodbard D. The Relationships Between Time in Range, Hyperglycemia Metrics, and HbA1c. J Diabetes Sci Technol. 2019 Jul;13(4):614-626
3. Beck RW, Bergenstal RM, Riddlesworth TD, Kollman C, Li Z, Brown AS, Close KL. Validation of Time in Range as an Outcome Measure for Diabetes Clinical Trials. Diabetes Care. 2019 Mar;42(3):400-405.
4. Lu J, Ma X, Zhou J. Association of Time in Range, as Assessed by Continuous Glucose Monitoring, With Diabetic Retinopathy in Type 2 Diabetes. Diabetes Care. 2018 Nov;41(11):2370-2376.
5. Battelino T, Danne T, Bergenstal RM, Amiel SA, Beck R, Biester T, Bosi E, Buckingham BA, Cefalu WT, Close KL, Cobelli C, Dassau E, DeVries JH, Donaghue KC, Dovc K, Doyle III JF, Garg S, Grunberger G, Heller S, Heinemann, L, Hirsch IB, Hovorka R, Jia W, Kordonouri O, Kovatchev B, Kowalski A, Laffel L, Levine B, Mayorov A, Mathieu C, Murphy HR, Nimri R, Norgaard K, Parkin CG, Renard E, Rodbard D, Saboo B, Schatz D, Stoner K, Urakami T, Weinzimer SA, Phillip M. Clinical targets for continuous glucose monitoring data interpretation: recommendations from the international consensus on time in range. Diabetes Care. 2019 Aug; 42(8):1593-1603.
6. Smalldone A. Glycemic Control and Hemoglobinopathy: When A1C May Not Be Reliable. Diabetes Spec.. 2008 Jan;21(1):46-49.
7. Frank RN. Diabetic retinopathy and systemic factors. Middle East Afr J Ophthalmol. Apr-Jun;22(2):151-6.
Newsletter
Want more insights like this? Subscribe to Optometry Times and get clinical pearls and practice tips delivered straight to your inbox.